Home › Features

Step 1 Find the field

Field scores, LiDAR and hot spots

First Rise scores crop fields along Ohio's creeks out of 100, then shows you the ground underneath: old creek channels, the first rise above the creek, soils, and the flint to look for. Here is how it picks out the fields worth walking, and where to start once you are there.

Screens below are from the app; the current version may look a little different. Owner names and places are hidden.

Why this field

What earned each field its score

Creeks wander, and the old channels they leave behind show up in LiDAR long after farming has smoothed them over. A favorite place to start is the first rise, the flat shelf of ground just above the creek.

Every field shows the creek from above, a side view across the ground, and a colored bar for each part of its score:
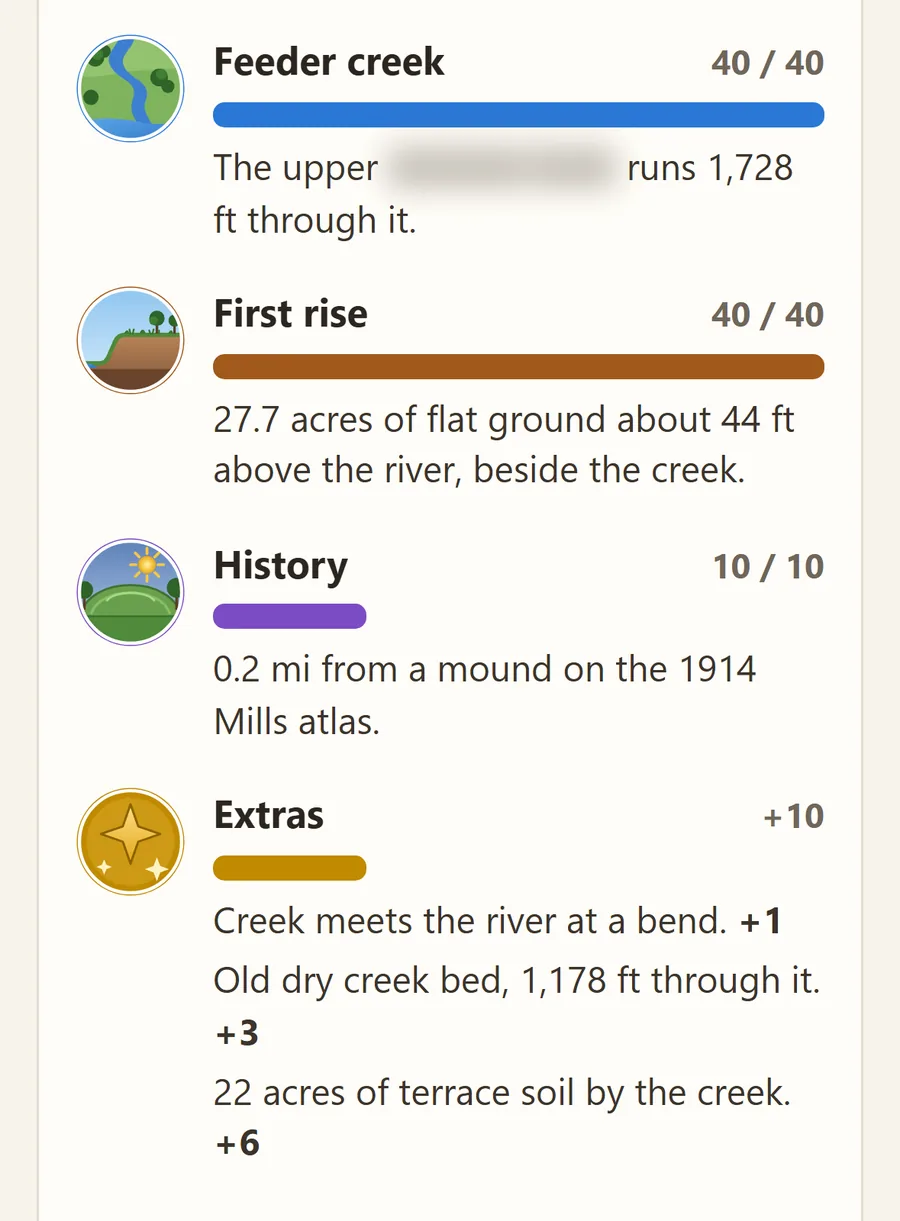
  • Feeder creek
  • First rise
  • History: old sites nearby, from the 1914 Mills atlas
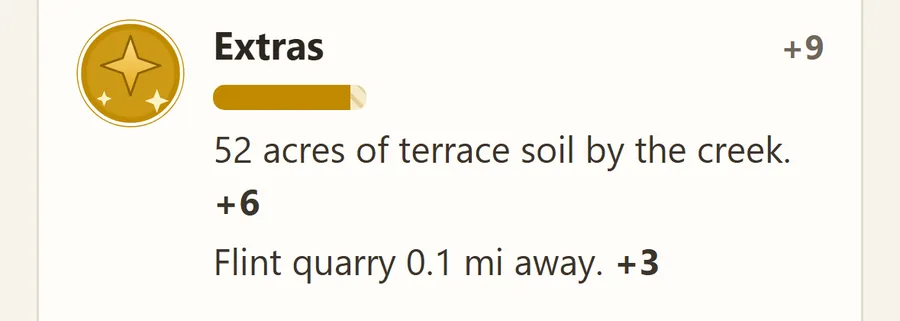
  • Extras: terrace soil, an old creek bed and more
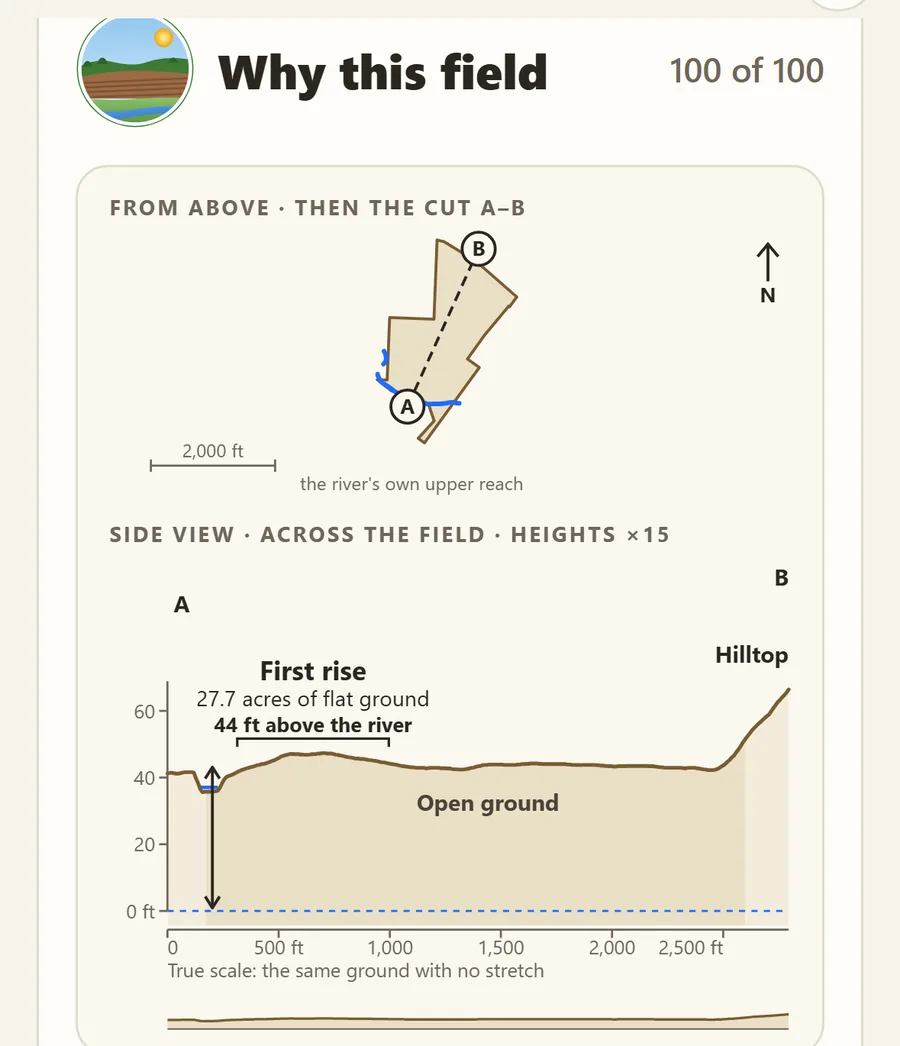
The Why this field card: the field from above with the cut A to B, then a side view across it showing the first rise, 27.7 acres of flat ground 44 feet above the river.
The side view: here the first rise holds 27.7 acres of flat ground 44 feet above the river.
The score's parts as colored bars with painted badges: Feeder creek 40 of 40 in blue, First rise 40 of 40 in brown, History 10 of 10 in purple, and Extras plus 10 in gold. A river name is blurred.
The score, part by part, in plain words.

Swipe to see both.

LiDAR ground maps

See the shape of the ground

LiDAR is a laser scan of the ground, flown from an airplane. With the crops and trees stripped away, the shape of the ground shows, and that is what makes LiDAR so useful for arrowhead hunting. First Rise turns it into maps you can read at a glance, with detail down to half a meter (about 20 inches) where the county's survey allows.

Tap the eye for a clean map: just the LiDAR, its hot spots and the field, with everything else out of the way.

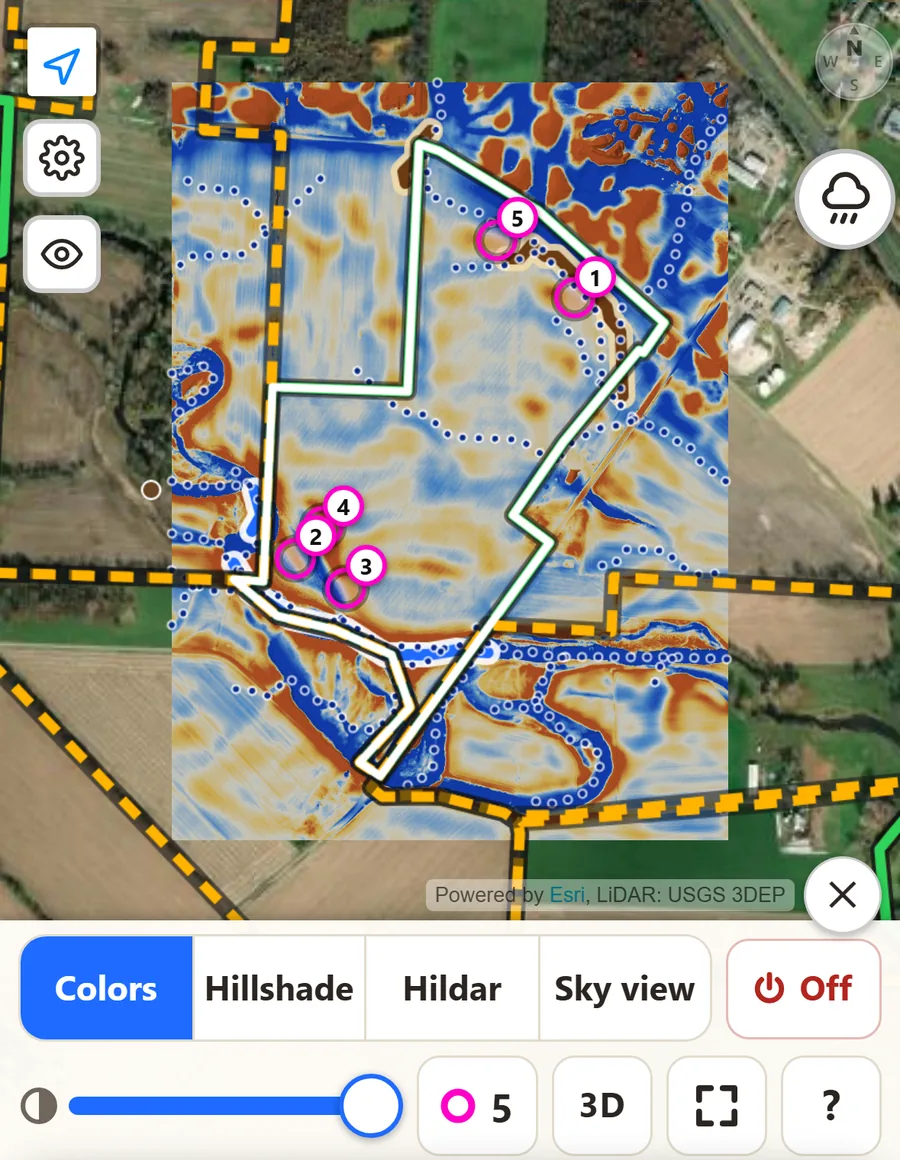
  • Colors
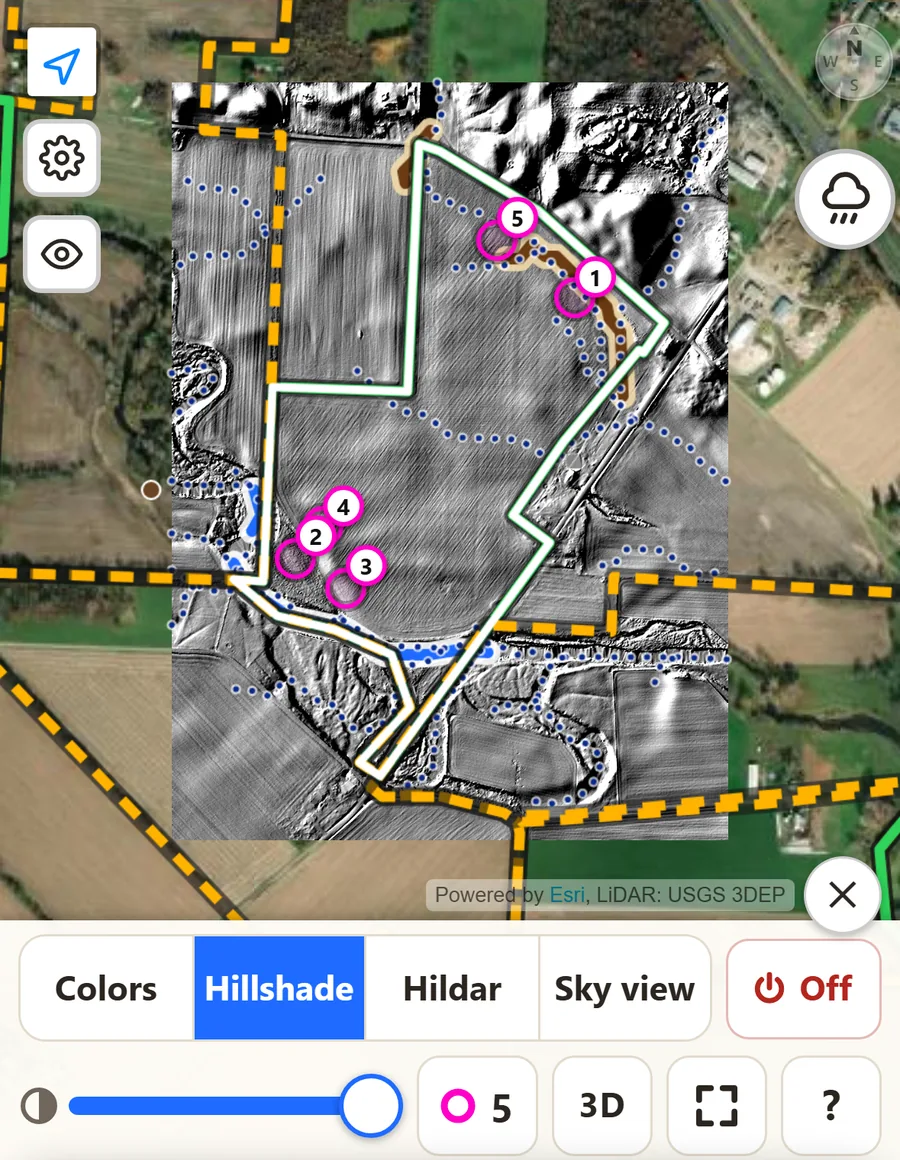
  • Hillshade
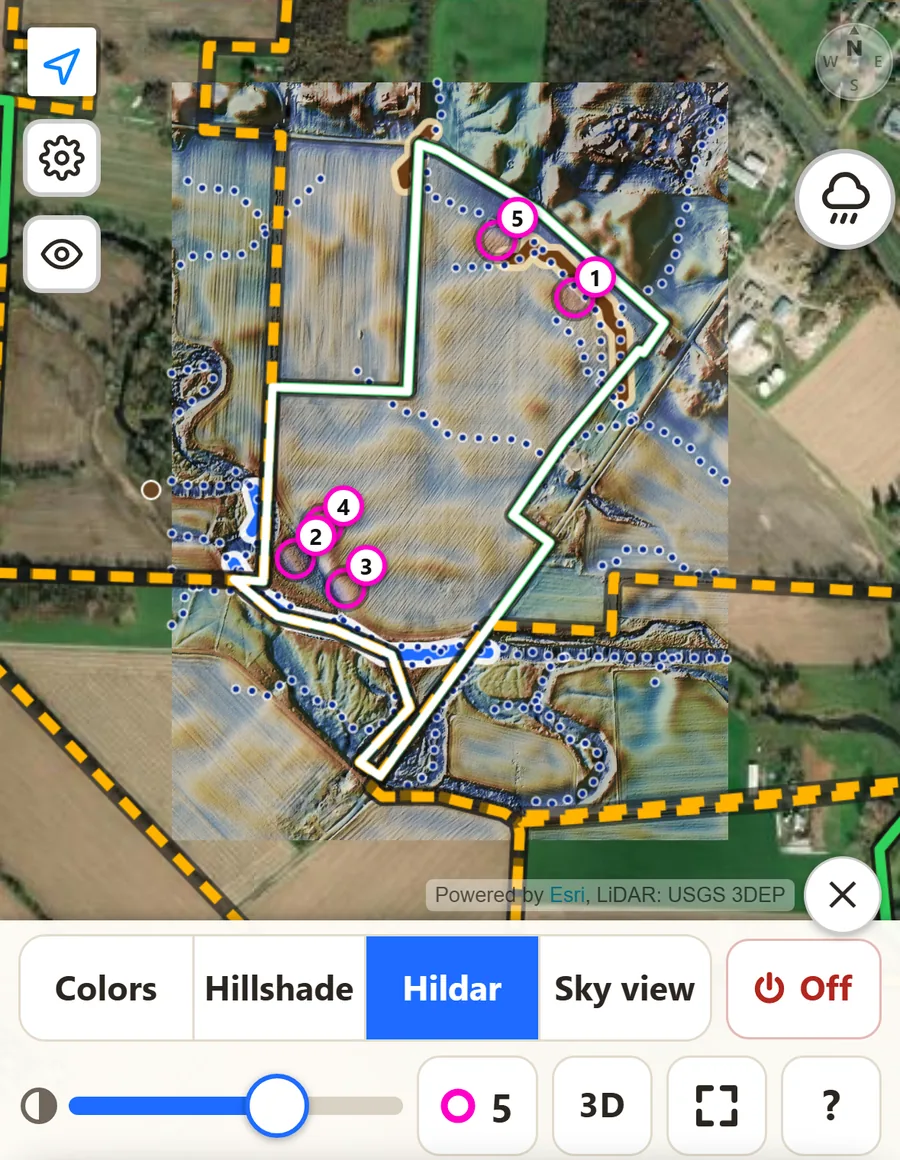
  • Hildar
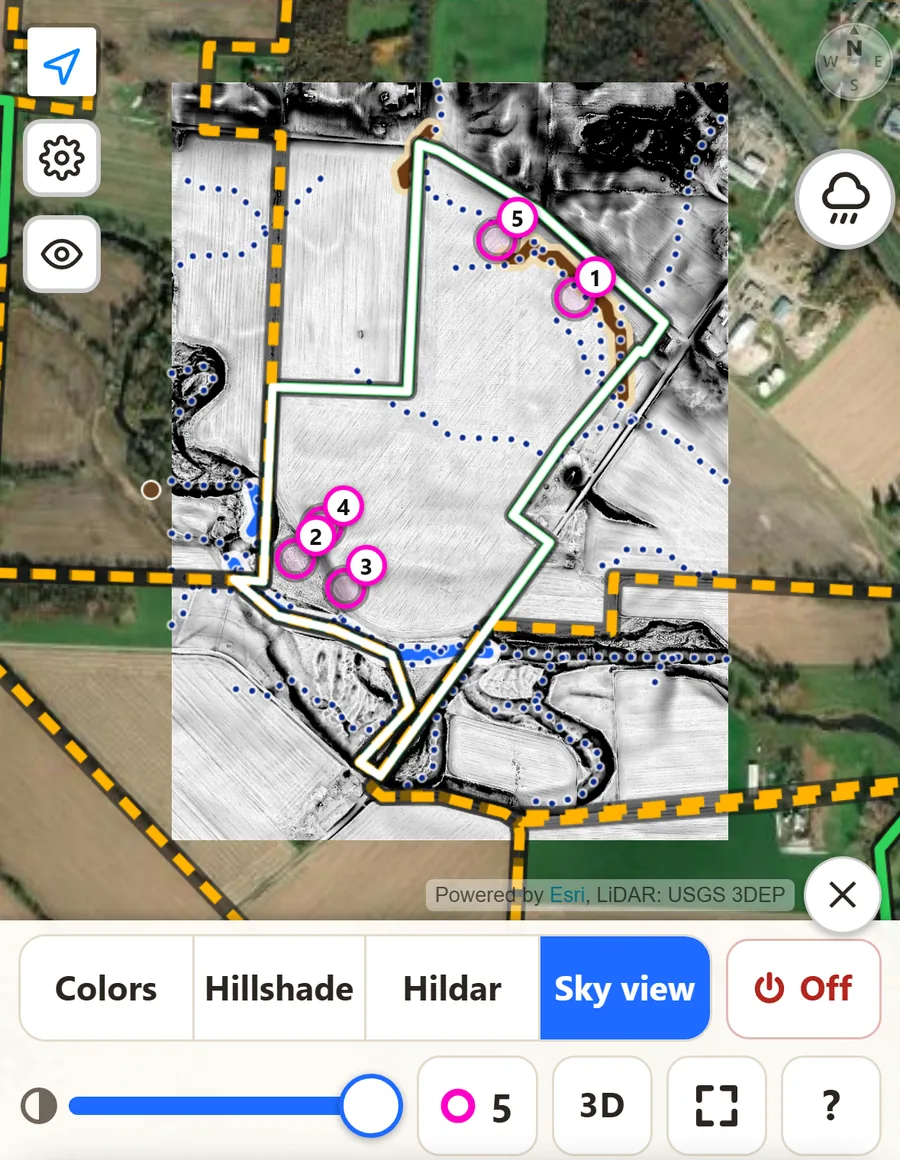
  • Sky view
LiDAR Colors map of a field: blue marks lower ground such as old creek channels, gold and orange mark higher ground, with magenta hot spots.
Colors: gold is a little higher, blue a little lower.
LiDAR Hillshade map of the same field in gray: the ground lit from one side, so banks, terraces and old channels cast soft shadows.
Hillshade: the ground lit from one side, so every bank and old channel casts a shadow.
LiDAR Hildar map of the same field: the height colors blended with the hillshade.
Hildar: the colors and the hillshade together: height and shape at once.
LiDAR Sky view map of the same field in black and white: dark spots mark hollows, old channels and ditches.
Sky view: dark spots see less sky. Hollows, old channels and ditches stand out.

Swipe to see all four views of the same field.

Hot spots

Hot spots: where to start walking

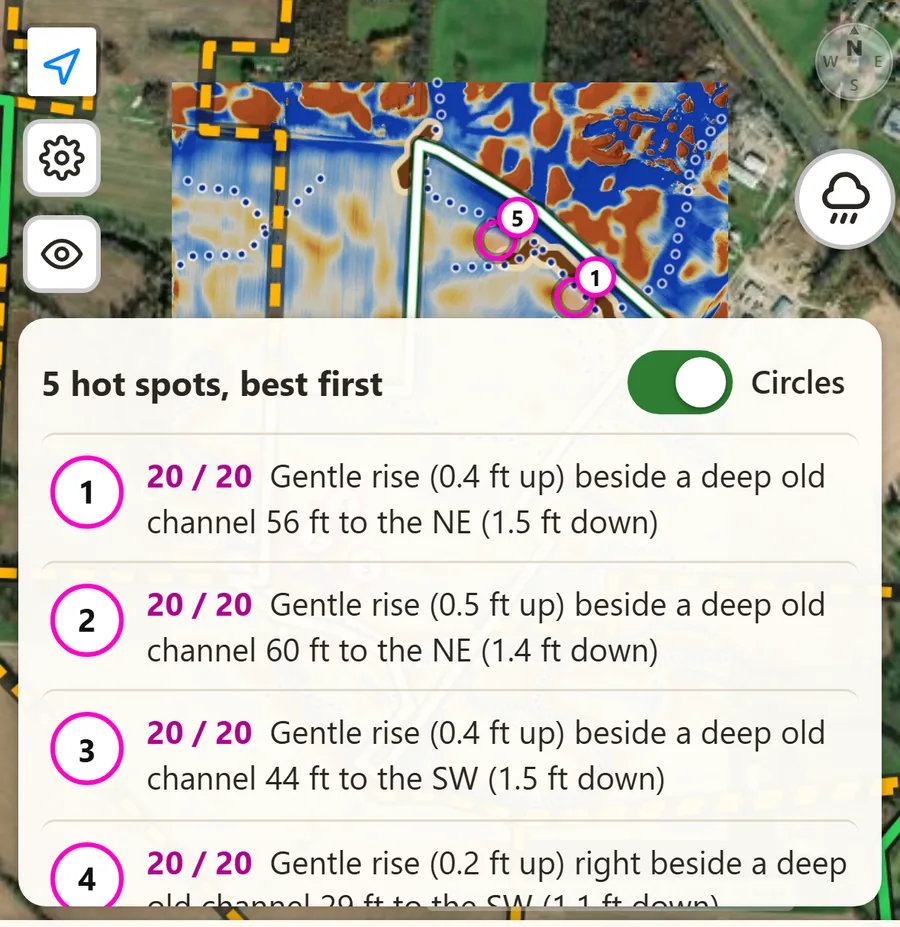
In every field, First Rise looks for the kind of place people most often camped: a gentle rise right beside a deep old creek channel. Each one gets a magenta circle on the map and a score out of 20, numbered best first.

Tap a hot spot to see why it scored, then tap Walk here: the app draws a line from your GPS dot to the spot and tells you how far it is.

The hot spot list over a LiDAR map: 5 hot spots, best first, each scored 20 out of 20, such as a gentle rise 0.4 feet up beside a deep old channel 56 feet to the northeast.

Harvest timing

Know when the crops are coming off

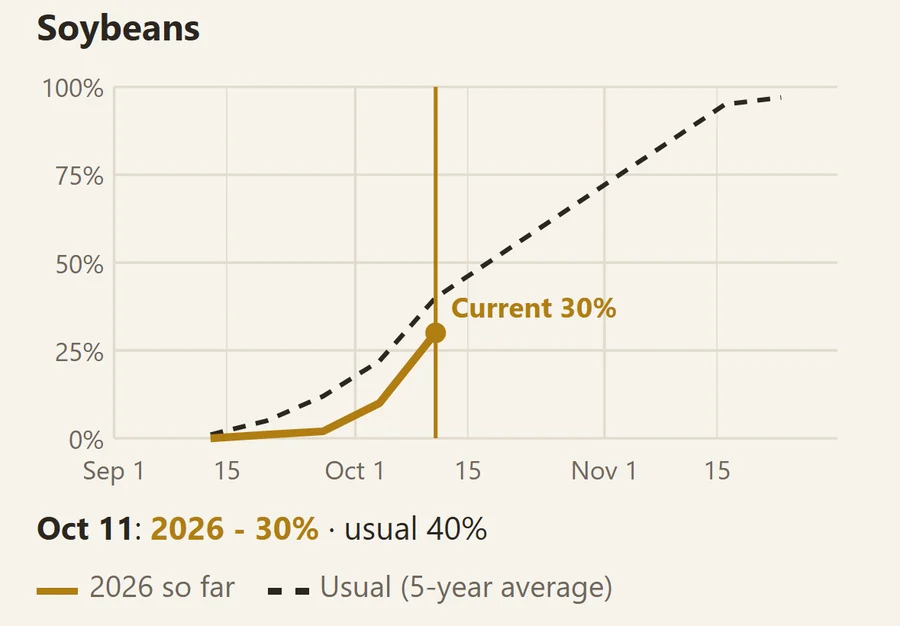
Most fields can't be walked until the crop is off. Every field shows how much of the state's corn and soybeans has been harvested so far, from USDA's weekly crop report, next to a usual year. Tap Chart to see the whole fall.

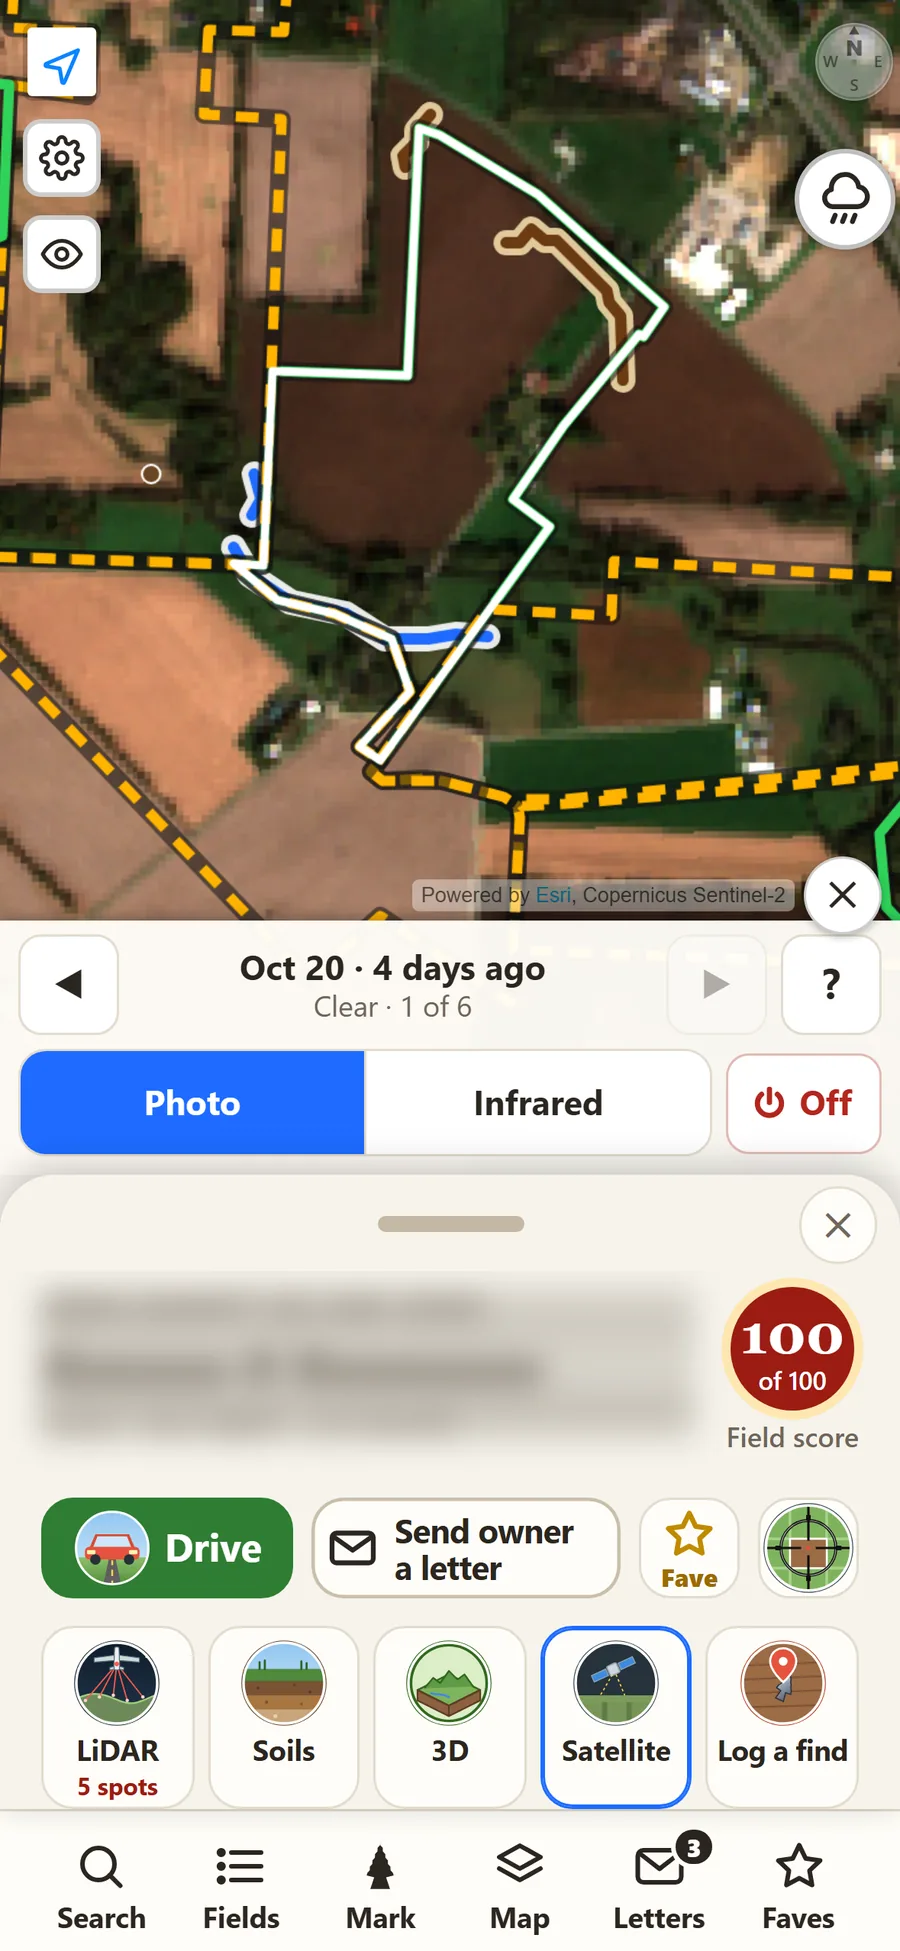
Then check the field itself: Satellite shows the latest clear pictures from space, a few days apart, so you can see bare ground before you drive out.

The soybean harvest chart: 30 percent harvested by October 11, against 40 percent in a usual year, with this year's line and the five-year average.
Harvest this fall, against a usual year.
The Satellite tool on a field: a clear picture from 4 days ago, with buttons to step through recent pictures and switch to infrared.
Satellite: the field as it looked a few days ago.

Swipe to see both.

Soil map

Read the soil at a glance

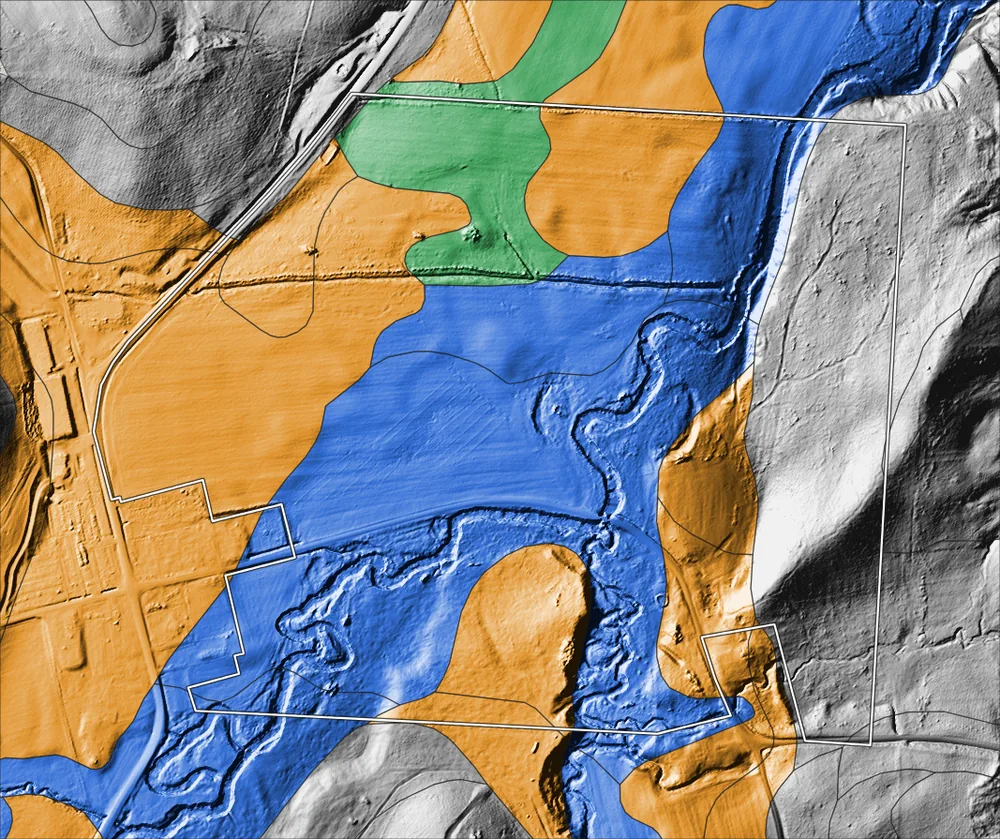
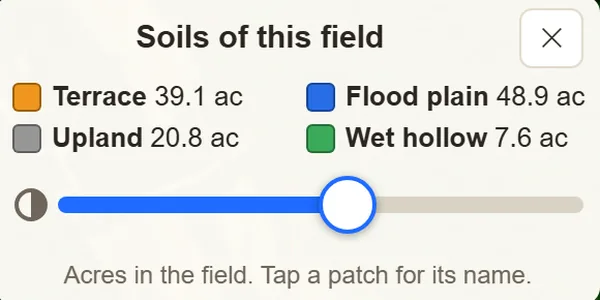
The USDA soil map is laid over the LiDAR in plain colors: terrace, flood plain, upland and wet hollow. See how many acres of each are in the field, and tap a patch for its soil name.

Soil colors draped over a LiDAR hillshade: orange terrace, blue flood plain with winding old channels, gray upland and green wet hollow.
The app's Soils of this field key: terrace, flood plain, upland and wet hollow, with acres for each.

3D view

Walk the field in 3D before you go

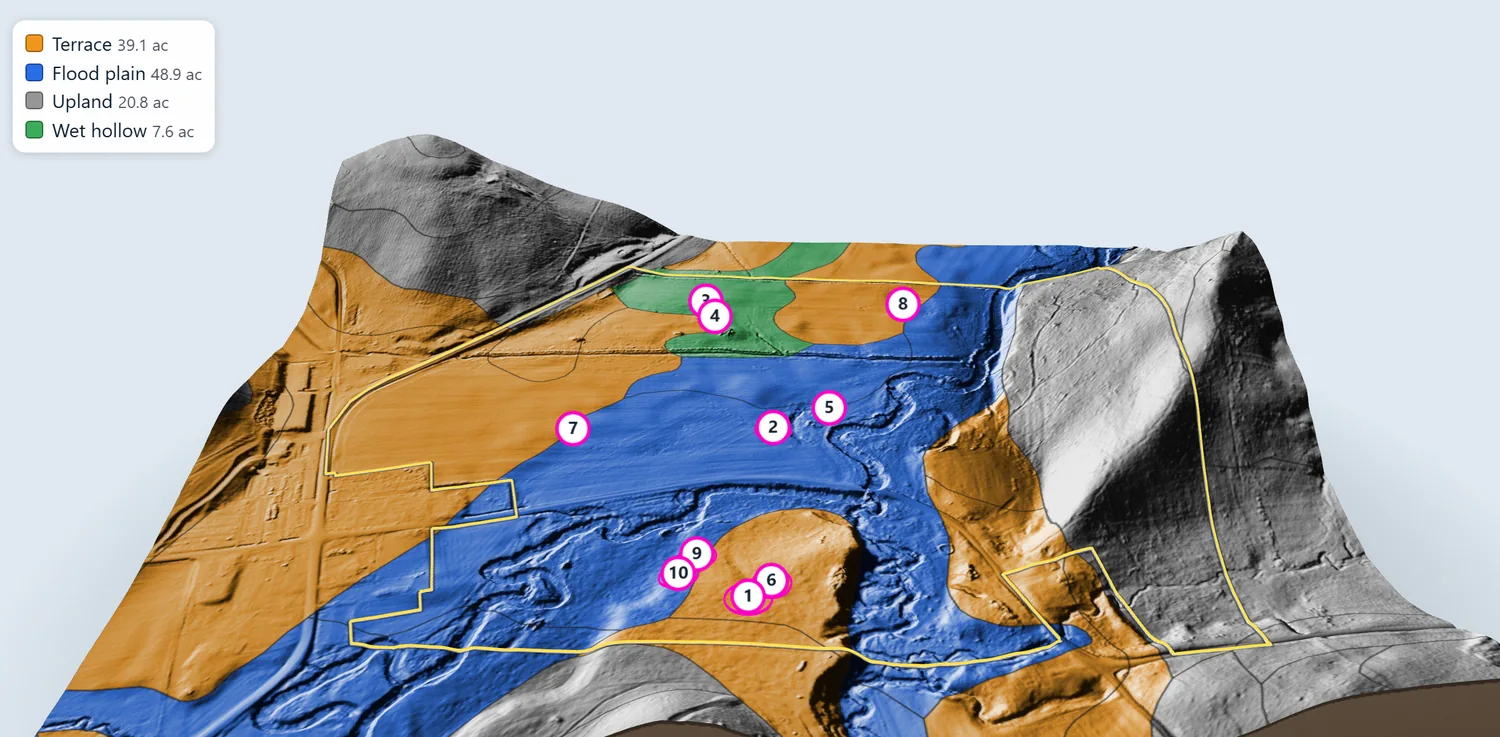
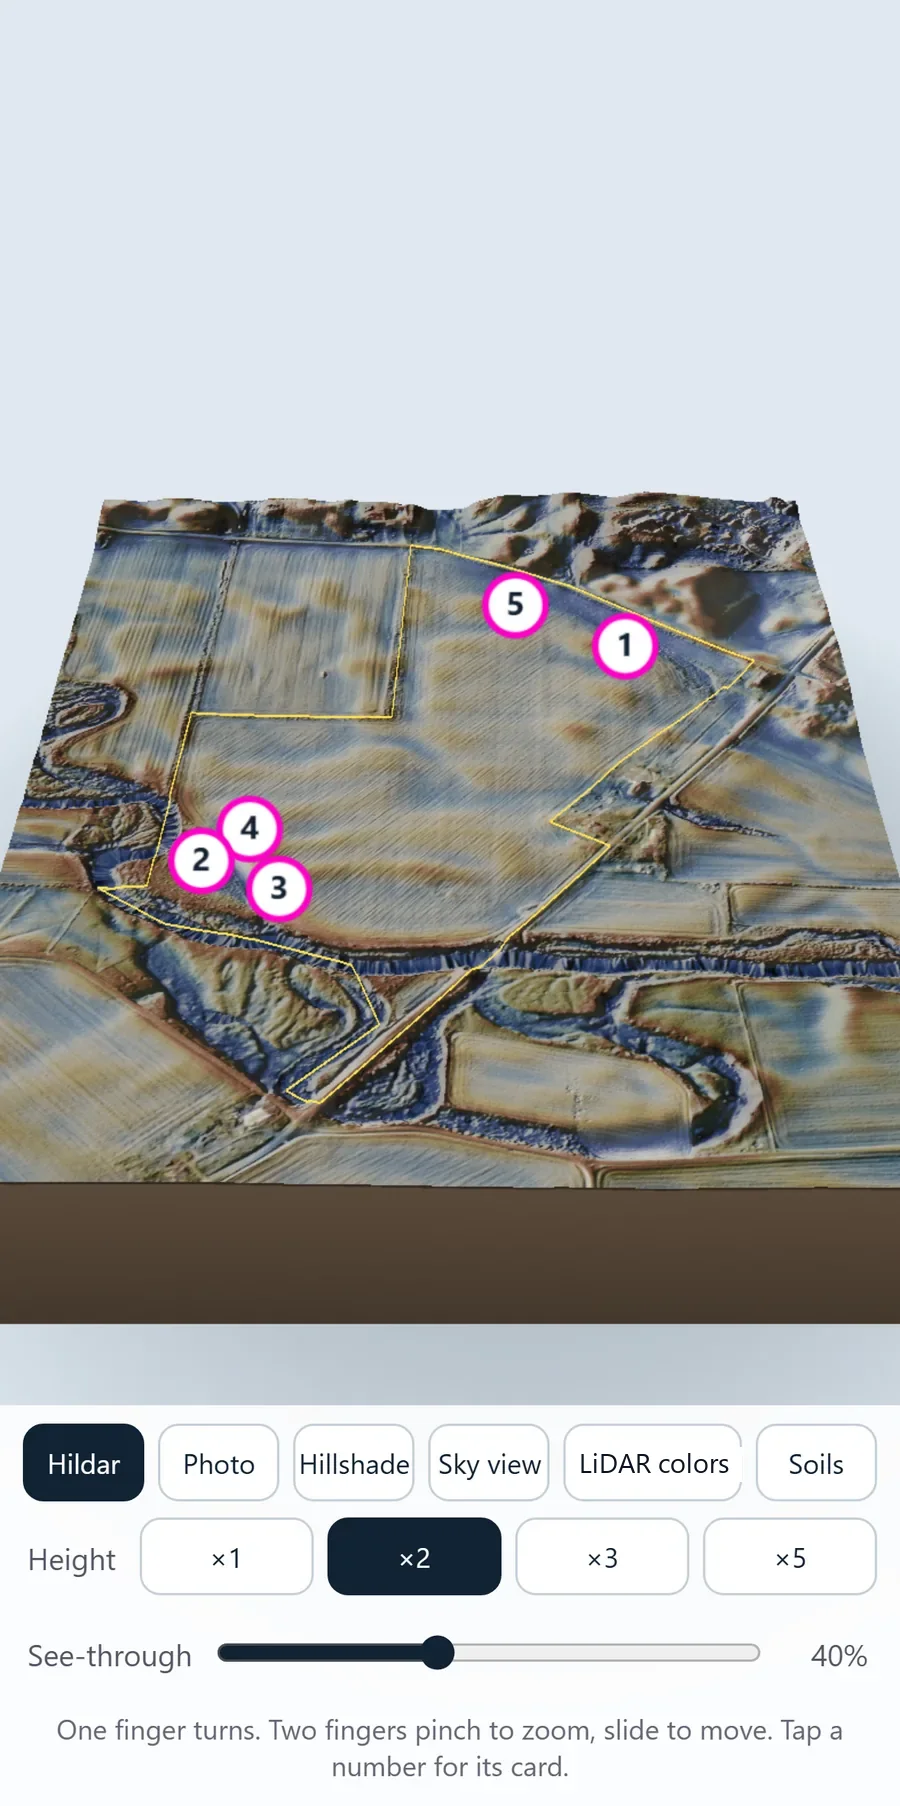
Turn a 3D model of any field with one finger and pinch to zoom. Stretch the height so banks and terraces stand out, slide the see-through control, and tap a numbered hot spot to see its card.

The app's 3D view of a crop field, colored by soil: orange terrace, blue flood plain, gray upland and green wet hollow, with numbered hot spots.
The same model colored by soil: terrace, flood plain, upland and wet hollow.
The 3D view of a field in the Hildar look with numbered hot spots, and buttons for the look, the height stretch and a see-through slider below.

Flint quarries

A bonus near the old flint quarries

People traveled a long way for good flint, then camped and worked it near where they dug it. A field close to a prehistoric flint quarry named in the old published reports gets up to 3 extra points, shown under Extras.

The Extras part of a field's score: 52 acres of terrace soil by the creek, plus 6, and a flint quarry 0.1 miles away, plus 3.